

What Grant Holmes’ Role Change Says About the Braves’ Rotation
Strikeout-to-walk ratio is already helping separate signal from noise

Astrophysicists use something called “signal-to-noise ratio” to measure how much useful information exists inside a noisy, congested universe. Exoplanet transit detection, gravitational wave astronomy, and cosmic shear measurements all depend on filtering through enormous amounts of noise to uncover tiny bits of data that help us better understand the cosmos.
Which, now that I think about it, is also a pretty good description of trying to evaluate pitchers in early May.
Because most early-season baseball statistics are noise. A bloop single here, a wind-blown homer there, one disastrous inning vaporizing a month of ERA.
But strikeouts and walks? Those are signal.
And Atlanta’s signals are getting interesting. Let’s talk about it.
The early stabilization point
A simple fact of baseball, one we’ve discussed before, is how so much baseball information takes a long time before it starts to actually mean anything.
Slugging percentage allowed? 550 at-bats. Batting average allowed? 630 batters faced. Home run rate for a pitcher? Try 1,320 batters faced before it starts becoming predictive.
For context, Braves closer Raisel Iglesias has faced 891 batters in his Braves career. That’s why we didn’t panic that Raisel Iglesias allowed seven homers in the first half of 2025, a driver of his 4.42 ERA. It was mostly random variance against him on the slider, before normalizing in the second half as he allowed a 1.76 ERA and just one home run.
But some of the first stats to stabilize for a pitcher are strikeout and walk rates. Your propensity to give out free passes is pretty baked once you’ve faced 170 batters, while your strikeout rate takes just 70 batters faced to be pretty descriptive.
And if you think about it, that makes sense. For the most part, your ability to get strikeouts and walks exists mostly independent of the play of your defense and park effects, with framing and the occasional ABS challenge among the few external influences.
That matters because several Braves pitchers are now around that threshold, and the team’s making decisions based on this information.
The three that count
The Braves have three starters that are either over or close to the threshold, helping explain some of the decisions Atlanta’s making.
Chris Sale has 164 batters faced and will pass the threshold in his next start, while Grant Holmes has 160 batters faced. Bryce Elder’s blown past the limit, already at 195 batters on the season.
Chris Sale: The Signal Looks Real
Atlanta’s veteran lefty is sporting a crisp 22.6% K-BB%, the 7th best mark in the sport for pitchers with 40 or more innings pitched.1
The batters above him represent a cross-section of the best-performing starters in the sport through the season’s first quarter.
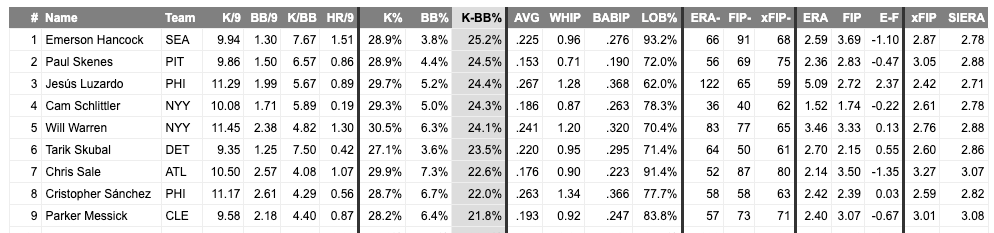
All but two of these starters have ERAs under two, and the two that don’t, Jesús Luzardo of the Philadelphia Phillies and Will Warren of the New York Yankees, are both sitting under 3.00 on virtually every ERA estimator there is - xERA, FIP, and SIERA.
Sale’s performance in that top group is earned by the inputs, although it’s important to note that he does have the largest gap between ERA and his estimators in this group.
Bryce Elder: A Throwback
There are multiple ways to be a dominant pitcher. In the days of TrackMan and Hawkeye and spin rates, the most common way is to be a ‘Stuff Monster’ and strike out nine batters per outing.
But that’s not the only way, and Bryce Elder’s 14.9% K-BB rate tells us that he’s getting done in more…old school ways.
Hall of Famer Greg Maddux had a relative down year by his standards in 1996, with his 2.72 ERA being the highest to that point in his Atlanta tenure and finishing four spots in Cy Young voting behind teammate and winner John Smoltz.
His K-BB% in that 1996 season was 14.7%.
I don’t drop that example to suggest that Bryce Elder is the next Greg Maddux - ‘Mad Dog’ established that ratio with a minuscule 2.9% walk rate, befitting his reputation as the greatest control pitcher of all time. Elder’s rocking a more normal 8.2% walk rate. Relative to league context, Maddux’s mark was more impressive than Elder’s current figure.
But the point here is that neither 1996 Maddux (17.6% K rate) nor 2026 Elder (23.1% K rate) have dominated from a strikeout perspective relative to their peers. Instead, they’ve been successful through minimizing hard contact and keeping the ball on the ground.
The profile appears relatively sustainable for Elder, although his groundball rate is about 5% below his career norms, so something to watch for there.
Grant Holmes: This Explains The Bullpen Move
In case you missed it, the Braves skipped Holmes’ scheduled start on Wednesday against the Mariners and announced he’d be available out of the pen this weekend versus the Dodgers in Los Angeles. Holmes joins fellow starters Reynaldo López and Didier Fuentes as bullpen options right now, although manager Walt Weiss clarified that Holmes will still be a candidate to get starts going forward.
It’s a return to the ‘utility pitcher’ role for Holmes, one he filled in 2024 en route to a 3.56 ERA and 1.2 fWAR in 68.1 innings.
It’s also a move that makes a ton of sense when you examine it through the lens of his 7.5% K-BB rate.
Something about starting seems to push Holmes’ walk rate upward. Here’s his K-BB and the two contributing ratios for each time through the order for Holmes:
1st: 27.6% K, 8.3% BB = 19.4% K-BB%
2nd: 20.7%K, 10.2% BB = 10.5% K-BB%
3rd: 22.6% K, 14% BB = 8.5% K-BB%
The two most plausible explanations here are either fatigue or sequencing.
Fatigue makes sense - the more tired you are, typically the more your control wavers and you miss spots. That would track.
But sequencing would also explain a lot, when you consider the other associated data. Holmes is markedly worse the 2nd and 3rd times through the order when it comes to opponent performance, in both ERA and the opposing hitters’ lines:
1st: 2.45 ERA, .196/.264/.304 allowed
2nd: 6.24 ERA, .286/.361/.496 allowed
3rd: 4.00 ERA, .232/.354/.406 allowed
When Holmes is sequencing well, he tends to start with a 4S-dominant attack the first time through the order, switching to featuring the slider the second time and then ramping up curveball and cutter usage the third time through. It’s not a hard and fast rule - if things are going well, he’ll stick with that adjusted four-seamer and ride it through an outing (Miami on 4/13, Philly on 4/19) - but he’s typically swapping to breaking balls the second time through.
Which would also help explain his walk rate regression when the lineup turns over - he just can’t reliably land breaking balls for strikes like he can the straighter fastballs.
None of this is to say that Grant Holmes is bad, per se, or unable to make it work as a starter if Atlanta needed that.
No, this is evidence of the Braves proactively putting Holmes in the role that best suits his skill set. He has significant struggles when the lineup turns over, requiring him to face the same hitters for the 2nd time in an outing. Since they have the rotation depth to do this, they’ve decided to change his role to eliminate some of the time he has to do that.
It’s no different from deciding that a hitter needs to be in a platoon and protected from pitchers of one specific handedness - it’s putting them in a position to be successful whenever they get into the game by taking away the opportunities to fail in those moments where their skill set doesn’t match.
What Atlanta Values
We’re continuing to learn what the Atlanta Braves value from their starting pitchers, a useful data point moving forward for everything from evaluating prospects to identifying potential trade or free agent targets.
The two archetypes Atlanta goes for are clear:
High whiff, high strikeout - these are classic “impact starters” that Anthopoulos referenced so often this winter and spring. They usually feature good velocity, one outlier swing-and-miss pitch, and the ability to rack up punchies in a hurry.
Examples: Chris Sale, Spencer Strider (2023 version, and hopefully 2026)
Groundball monsters - these are the well-sequenced, soft-contact-inducing groundball guys that can go seven innings at the drop of a hat if everything’s working. They typically throw a bit softer than the Sales of the world, but when they’re on, the runs allowed on the scoreboard are roughly the same.
Examples: Bryce Elder, JR Ritchie, Martín Pérez
Holmes doesn’t fit either box: He gets above-average whiffs, sure, but it hasn’t translated into even an average strikeout rate so far this season. He’s roughly league average for barrel and groundball rates: not getting crushed, but not excelling either.
So they found a custom role for him. And from experience, we know he can fill it well.
The Bigger Picture
This is why strikeout-to-walk ratio matters.
Not because it’s perfect. Not because it predicts everything. But because it starts cutting through the noise earlier than most statistics do.
At around 170 batters faced, the picture becomes clearer. And for Atlanta’s rotation, that picture is increasingly splitting into distinct groups.
Chris Sale still looks like a frontline arm. Bryce Elder continues to walk a narrow but workable line. And Grant Holmes’ profile increasingly resembles that of a bulk reliever or swingman more than a traditional starter.
That doesn’t mean the Braves are making decisions purely off one statistic. But it does mean the signal is getting strong enough that it’s helping shape how Atlanta deploys its pitching staff.
And that matters beyond May.
Because this is the same kind of information that influences playoff rotations, trade deadline targets, and how the Braves evaluate future starters moving forward.
The noise is starting to fade. What’s left is getting harder to ignore.
Frustratingly, FanGraphs won’t let me set batters faced as a criterion, but 40 innings seems to come pretty close to replicating that same eligibility filter.
Great article as always, Lindsay. Thoughts on JR Ritchie's increase in walks after having very good control in the minors? Signal or noise?