

Why 2026 Feels Like a Pitcher Optimization Year for Atlanta
Most of the pieces already work. The question is whether the Braves can fine-tune them.

There have been several trends to sweep baseball in general and pitching development specifically the last few seasons, whether it’s the design and implementation of new pitches (the kick-change, the sweeper before that, or the embrace of the splitter) or just the concept that throwing more pitches (specifically, all three fastballs or multiple styles of sliders) is a good thing to be embraecd.
But I want to go one step further - I want 2026 to be the year of pitcher optimization.
Let’s talk about Nash Score.
What is Nash Score?
First created by former FiveThirtyEight sports editor Neil Payne, Nash Score is an attempt to quantify sequencing.
No wait, let’s back up a bit, to sequencing versus frequency. Regular readers/listeners hear me talk about how guys use their pitches, frequently discussing how a pitcher’s arsenal changes against lefties versus righties.
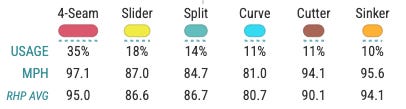
Here’s an example graphic from Statcast, looking at Spencer Schwellenbach.
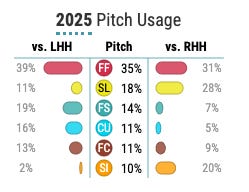
See how Schwelly is four-seam dominant to left-handed hitters, backing that up with almost equal usage of the splitter and curveball, followed by roughly equal usage of the slider and cutter, and throwing almost no sinkers? That’s his pitch mix versus lefties, which we often abbreviate to the “frequency” he throws each pitch. Against righties, by contrast, his slider is his second pitch, followed by the sinker but nothing else over 10% usage.
But that chart doesn’t tell you when in the at-bat he throws each pitch and if it was the best choice at that moment, just the end-of-season totals of what he threw and how often.
The when in the at-bat? That’s sequencing, and here’s a ‘Plinko’ chart from Statcast for Hurston Waldrep to illustrate:
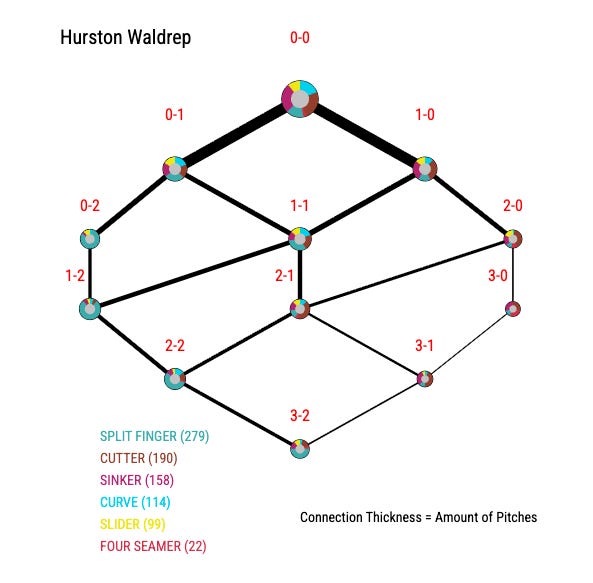
See how his most common pitch in all two-strike counts is his splitter? That’s sequencing.
And working off of that, Nash Score is trying to quantify the effectiveness of that sequencing - how good you are at throwing the right pitch at the right moment.
Here’s Paine, explaining how he takes a pitch effectiveness measure from FanGraphs and manipulates it to create Nash Score:
“Start by measuring, for each pitch type, the difference between its effectiveness and that of all the pitcher’s other pitches combined. Then weight those differences according to the frequency with which each pitch is thrown. The resulting average is the Nash Score, a sort of variance that measures whether a pitcher is close to his equilibrium (lower score) or could conceivably benefit from varying the distribution of his pitches (higher score).”
To simplify this somewhat: the lower the score, the better job you’re doing at balancing the effectiveness of all of your pitches in your arsenal.
Here’s an example of poor Nash Scores put in action: Atlanta’s been able to find some reliever gems out of Colorado in Pierce Johnson and Tyler Kinley, as both were over-relying on fastballs and under-relying on their dominant breaking balls. Johnson’s curveball usage spiked from mid-50% to nearly 75% here in Atlanta, while Kinley’s slider usage morphed from 53.5% usage to begin 2025 to over 70% once he joined the Braves at the trade deadline. We don’t know exactly how Atlanta identified Kinley and Johnson as trade targets - maybe they’re looking at Stuff+ reports, maybe they’re looking at a Nash Score - but either way, they figured out that these guys were under-utilizing really good breaking balls and targeted the players via trade.
Here’s what we can learn from Nash Score
Payne published a convenient Nash Score interactive chart over the summer, and there are a few observations to make for the Braves.
(Note: I screenshotted the chart below for mobile users, but the actual chart is best viewed on a computer, as hovering over a specific pitcher’s dot on the chart will give you his details.)
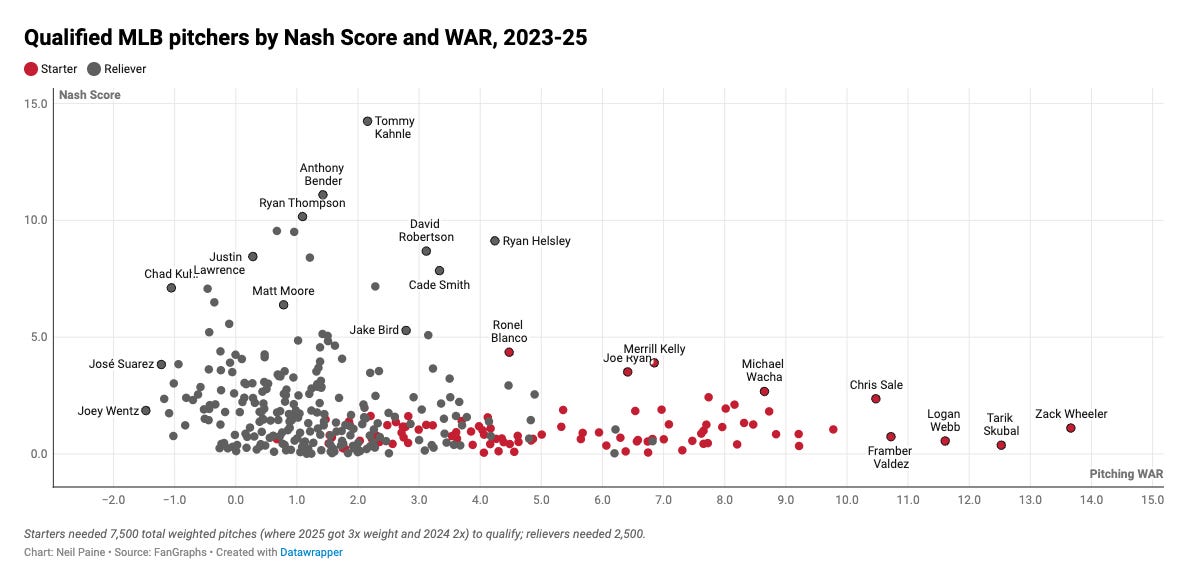
The first is that starters, by their very nature, are already pretty optimized when compared to relievers. And if you think about that, it makes sense - starters are trying to get the same hitters out two or three times in the same game, whereas any given reliever might not see a non-divisional hitter more than once or twice in the same season.1
On a side note, this is why reliever performance in the postseason feels more volatile - those relievers are seeing the same group of hitters for three or five or even seven consecutive games. Toronto Blue Jays closer Jeff Hoffman pitched against the Los Angeles Dodgers four times in the World Series, facing Freddie Freeman, Will Smith, and Teoscar Hernandez three times each. The 18th hitter he faced in the series, veteran infielder Miguel Rojas, tagged him for a home run in game seven’s ninth inning after Hoffman went to the slider well one too many times, a tendency Freeman had tipped off Rojas about. Both LA and Toronto (with Chris Bassitt) showed us the value of ‘extra’ starters working as relievers in a postseason series, as they were able to get outs against the same hitters repeatedly throughout the series.
The other observation from the chart is that the larger the arsenal, the…easier it is to use them efficiently. Wait, what?
We can look at Chris Sale here to explain this - the big lefty ostensibly has a four-pitch arsenal, combining his devastating slider and four-seamer with a changeup and sinker. Those last two pitches, however, barely get used a combined 10% of the time overall (7% changeup, 3% sinker) and it’s strongly influenced by handedness - sinkers to lefties, changeups to righties.
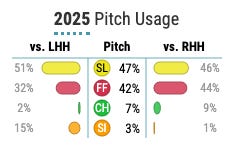
With less pitches at his disposal, Sale’s frequently stuck in the position of throwing something that’s not the “optimal” offering for a specific situation, simply because he doesn’t have many other options. If he’s facing a good slider hitter and needs a third strike, he’s likely going to throw the slider anyway because that’s his best whiff pitch, numbers or opponent success be damned.
Now clearly, Sale’s good enough to get away with doing that. Of all pitchers in Paine’s three-year sample with ten or more WAR, Sale’s the only one with a Nash Score over 1.252 and his 2.36 is sixth-highest in the entire sample of qualified starters. Charlie Morton, who also relies on one outlier-breaking pitch? Another lower-scoring pitcher by Nash Score, coming in at 1.41.
But what about a guy like Bryce Elder, who throws those same four pitches but with lesser results? His sequencing needs to be practically perfect.
For an example of Nash Score confirming what we see with our eyes and ERA, take Spencer Schwellenbach. He sports a Nash Score of just 0.64, grading out absurdly balanced and optimized. Is there a coincidence that his pitch mix is six deep, featuring two breaking balls and all three fastballs? Possibly, but I tend to give the credit to his evenly distributed usage - Nothing except the four-seamer gets thrown even 1/5th of the time, with five different pitches all coming in between 10% and 18%.
To make a point on usage driving this instead of the size of arsenal, both A.J. Minter (0.08 Nash Score) and Joe Jiménez (0.03 Nash Score) grade out very well in the model. Both relievers, when healthy, also throw three pitches and mostly don’t exceed 50% usage on any of them.3
As the team is pairing several starters who have added pitches recently with new pitching coach Jeremy Hefner and his “kitchen sink” approach, I expect the team to get more optimized over time. Hefner clearly thinks about pitching from a different angle than the previous coaching staff did, with Hefner telling the AJC’s Ken Seguira recently that supplementing a pitcher’s best pitch with other options is the best way to avoid decay in the effectiveness of the primary offering. It’s like a redwood forest, he told Seguira, where the trees get most of the attention but “sometimes you lose sight of all the things that have helped them grow to how big they are,” he explained, referring to “the squirrels or the grass or the foliage underneath.”
Hopefully, the Braves have a great approach to forest management on tap for 2026.
Raisel Iglesias pitched in three of Atlanta’s six games against the Pittsburgh Pirates last season, facing thirteen total batters. The only hitters he faced more than once were Joey Bart and Bryan Reynolds.)
The rest are Zack Wheeler at 1.11, Tarik Skubal at 0.37, Logan Webb at 0.55, and Framber Valdez at 0.74.
It’s not always the size of the arsenal, it’s how you use it.
Updated information from BA
Braves 2nd largest bonus will go to de la Cruz, a super speedy 5'9" Dominican centerfielder with lots of power for his size.
Very interesting. I had never considered the fact that, in the post-season, unlike the regular season, relievers have to face the same hitters multiple times, as starters do all season.